What are Support and Resistance in Technical Analysis?
Support and Resistance are technical analysis tools to help stock traders find the theoretical lows and highs of a stock price over a trading period. The idea behind support and resistance levels are that when a stock price approaches or touches these support and resistance levels, the price will generally reverse rather than breaking through.
The support level is the “bottom” or “low” price. Generally, a stock’s support level will have many buyers willing to buy at that price, making it more difficult to decrease further in price. The stock price tends to find “support” at this lower price level.
The resistance level is the “top” or “high” price. A stock’s resistance level will have many sellers willing to sell at or near the resistance price, making it difficult to increase in price and form higher highs. The stock price tends to find “resistance” to going above this price level.
What do Support and Resistance tell us about a stock and how do they work?
Support and resistance can be a predictive indicator of a stock’s sentiment and directional movement trend. Support and resistance can help traders identify trends for a stock and identify if the sentiment is generally bullish or generally bearish.
When a stock price rises above the resistance level, this can be a sign of bullish sentiment and the stock price may continue going up.
Conversely, when a stock price falls below the support level, this is seen as a bearish sentiment, and the stock price may continue falling.
Visualizing Support and Resistance Levels on a Stock Chart
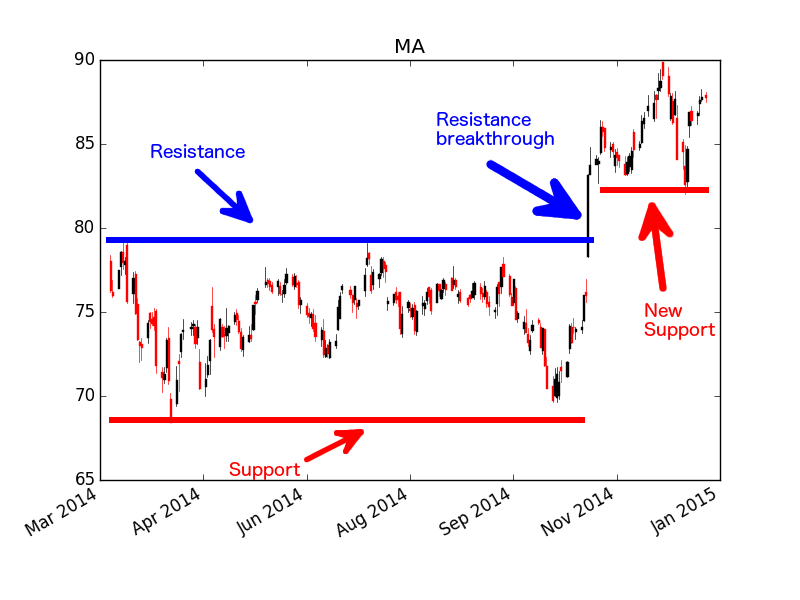
In this chart example of MasterCard – $MA you can see the following: support, resistance, breakthrough of resistance leading to higher highs, and a new support base forming. This resistance breakthrough is a bullish signal and trading pattern for MasterCard – $MA.
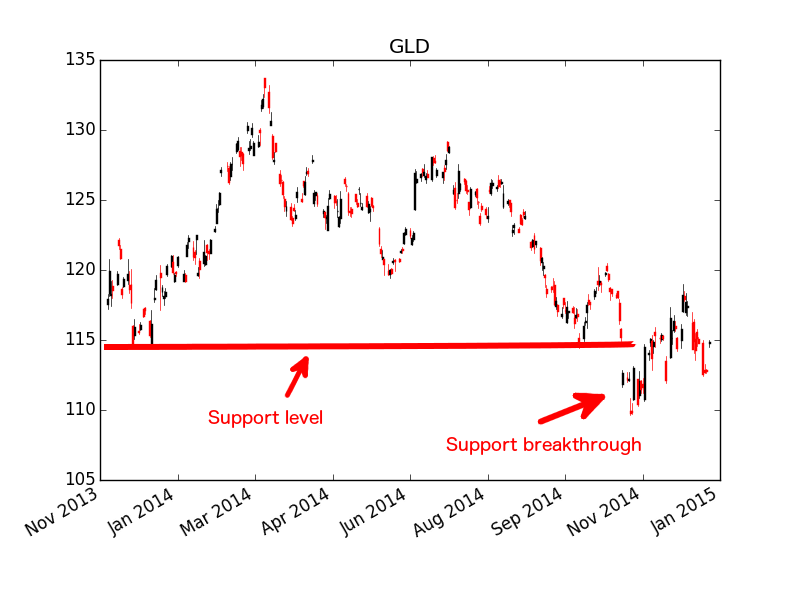
In this next example of Gold ETF – $GLD you can see the support level and then a breakthrough of support leading to lower lows. The breakthrough of the support level represents a bearish signal for the gold ETF $GLD.
Calculating Support, Resistance, and Pivot Points
Determining the support and resistance levels is an easy calculation. First we need to calculate the pivot point price, and then we calculate the support and resistance levels based on the pivot point value.
Calculating Pivot Points
The most common pivot point calculation method uses the high, low, and close prices of the previous trading period. If you were using end of day stock price data, these values would be the previous day’s high, low, and close prices.
P = (H + L + C) / 3
Alternatively, we can calculate the pivot point including the previous period’s opening price (O):
P = (O + H + L + C) / 4
- P = pivot point
- O = open
- H = high
- L = low
- C = close
Calculating Support and Resistance Levels
Once we have calculated the pivot point, we will use the pivot point value to calculate support and resistance levels.
Most traders will calculate only one set of support and resistance values, called S1 or first support and R1 or first resistance, which is the most significant set of support and resistance levels.
R1 = P + (P - L) = 2×P - L
S1 = P - (H - P) = 2×P - H
Some traders, however, will also calculate additional support and resistance levels: second set of support and resistance (S2 and R2), and third set of support and resistance (S3 and R3). These additional sets are above and below the first set of support and resistance levels.
R2 = P + (H - L)
S2 = P - (H - L)
R3 = H + 2×(P - L) = R1 + (H - L)
S3 = L - 2×(H - P) = S1 - (H - L)
Example calculations of pivot point, support, and resistance
Let’s perform support, resistance, and pivot point calculations for the S&P 500 ETF – $SPY as an example exercise.
Here are the current previous close, open, high, and low values for $SPY:
- O = open = 208.31
- H = high = 208.85
- L = low = 208.25
- C = close = 208.44
Step 1: Calculate $SPY pivot point:
P = (H + L + C) / 3
P = (208.85 + 208.25 + 208.44) / 3
P = 208.5133
The pivot point price for $SPY is 208.51 (rounded).
Step 2: Calculate $SPY first support level:
S1 = P - (H - P) = 2×P - H
S1 = 208.5133 - (208.85 - 208.5133)
S1 = 208.1766
The support price of $SPY is 208.18 (rounded).
Step 3: Calculate $SPY first resistance level:
R1 = P + (P - L) = 2×P - L
R1 = 208.5133 + (208.5133 - 208.25)
R1 = 208.7766
The resistance price of $SPY is 208.78 (rounded).
Final Thoughts on Support and Resistance
Support and resistance are very useful tools in the trader’s toolbox. But with all technical analysis, you should perform thorough due diligence and additional research before buying and selling.
A trader will not buy and sell based on support and resistance levels alone . They will combine support and resistance with other fundamental analysis and technical analysis signals.
Support and resistance patterns can help traders spot stock market trends, help identify bullish and bearish sentiments, and to signal breakouts if a stock has broken through the resistance.